
The defining data and analytics trends for 2026 are not just new tools but a structural shift toward AI-driven, real-time, governed, and automated decision systems — forcing organizations to rethink skills, architecture, and strategy.
Most organizations already collect more data than they can use. Dashboards multiply. Reports pile up. Decisions still rely on intuition or outdated summaries.
In 2026, the competitive edge will not come from having data — it will come from systems that convert data into timely, trustworthy action automatically.
The short answer to “what matters most?” is this: Analytics is moving from hindsight → insight → foresight → autonomous execution.
Research across industry reports and academic work shows AI-assisted analytics, real-time processing, and privacy-aware architectures becoming foundational capabilities rather than optional upgrades.
Table of Contents
Why 2026 Is a Turning Point
For two decades, analytics answered: “What happened?”
Now it answers: “What should we do next — automatically?”
| Analytics Era | Primary Question | Typical Output | Business Impact |
| Descriptive | What happened? | Reports | Historical awareness |
| Diagnostic | Why did it happen? | Analysis | Root-cause insight |
| Predictive | What will happen? | Forecasts | Planning advantage |
| Prescriptive | What should we do? | Recommendations | Decision support |
| Autonomous (2026+) | Do it automatically | Actions | Operational transformation |
Organizations that fail to move beyond dashboards will increasingly fall behind competitors using AI-driven operations.
Top Data and Analytics Trends for 2026
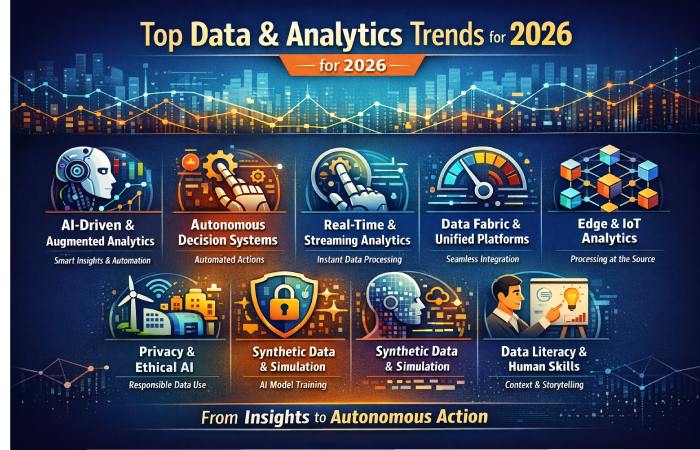
1) AI-Driven & Augmented Analytics
AI is no longer a specialized capability — it is becoming the default layer of analytics tools.
Augmented analytics uses machine learning to automate data preparation, insight discovery, and explanation.
Why It Matters
- Reduces dependency on scarce data experts
- Accelerates insight generation
- Improves accessibility for non-technical users
| Aspect | Traditional Analytics | AI-Augmented Analytics |
| Data prep | Manual | Automated |
| Insights | Analyst-driven | AI-suggested |
| Speed | Slow | Rapid |
| User skill needed | High | Moderate |
Implication: Analysts shift from builders to validators and interpreters.
2) Autonomous Decision Systems
The biggest shift for 2026: analytics triggering actions without human intervention.
Examples:
- Dynamic pricing engines
- Fraud detection systems
- Supply chain optimization
- Personalized recommendations
| Use Case | Insight-Only System | Autonomous System |
| Retail pricing | Reports trends | Adjusts prices automatically |
| Cybersecurity | Alerts | Blocks threats instantly |
| Manufacturing | Identifies defects | Stops production line |
These systems dramatically reduce response time and human workload — but introduce governance risks.
3) Real-Time & Streaming Analytics
Waiting hours or days for reports is increasingly unacceptable.
Industries adopting real-time analytics fastest:
- Finance
- E-commerce
- Logistics
- Telecommunications
- Healthcare monitoring
| Decision Type | Batch Analytics | Real-Time Analytics |
| Marketing campaigns | Post-campaign analysis | Live optimization |
| Fraud detection | After-the-fact | Instant blocking |
| Inventory | Periodic review | Continuous adjustment |
Real-time insight is becoming the baseline expectation.
4) Data Fabric & Unified Architectures
Many organizations suffer from fragmented data stored across systems.
A data fabric connects sources into a unified environment without centralizing everything physically.
| Problem | Fragmented Architecture | Data Fabric Approach |
| Data silos | Common | Reduced |
| Integration effort | High | Lower |
| Scalability | Limited | High |
| Time to insight | Slow | Faster |
Unified architectures also enable AI models to access comprehensive datasets, improving accuracy.
5) Edge Analytics & IoT Intelligence
As devices generate massive data streams, processing at the source becomes essential.
Edge analytics analyzes data locally instead of sending everything to the cloud.
Applications include:
- Smart factories
- Autonomous vehicles
- Retail sensors
- Energy grids
| Benefit | Cloud-Only Processing | Edge + Cloud |
| Latency | High | Low |
| Bandwidth usage | Heavy | Reduced |
| Reliability | Dependent on connection | More resilient |
| Privacy | Lower | Higher |
Edge intelligence will expand as IoT adoption grows.
6) Privacy-First & Ethical Data Use
Regulations such as GDPR and CCPA have transformed data governance into a strategic issue.
Organizations now compete on trust as well as performance.
| Factor | Low Governance | Strong Governance |
| Compliance risk | High | Lower |
| Customer trust | Weak | Strong |
| Data usability | Uncertain | Reliable |
| Long-term viability | Risky | Sustainable |
Responsible data use is increasingly viewed as a competitive advantage, not merely a legal obligation.
7) Synthetic Data & Simulation
Synthetic data — artificially generated but statistically realistic — is gaining traction.
Use cases:
- Training AI without exposing real personal data
- Testing scenarios that lack historical examples
- Balancing biased datasets
| Advantage | Real Data | Synthetic Data |
| Privacy risk | High | Low |
| Availability | Limited | Scalable |
| Bias control | Difficult | Adjustable |
| Cost | High | Potentially lower |
Synthetic data is especially important for sensitive domains like healthcare and finance.
8) Data Democratization & Self-Service Analytics
Organizations want more employees to use data without relying on specialists.
Self-service tools allow business users to explore data directly.
| Benefit | Centralized Analytics | Self-Service Analytics |
| Speed | Slower | Faster |
| Scalability | Limited | Broad |
| Consistency | Higher | Variable |
| Training needs | Lower | Higher |
However, democratization must be balanced with governance to avoid chaos.
9) Data Observability & Reliability
As data pipelines grow complex, ensuring data quality becomes mission-critical.
Data observability monitors freshness, accuracy, and completeness.
| Risk Without Observability | Impact |
| Broken pipelines | Wrong decisions |
| Outdated data | Missed opportunities |
| Inconsistent metrics | Organizational conflict |
Reliable data infrastructure is the invisible backbone of modern analytics.
10) Human-Centered Analytics Skills
Ironically, the more automated analytics becomes, the more valuable human judgment becomes.
Critical skills for 2026:
- Problem framing
- Domain expertise
- Ethical reasoning
- Communication and storytelling
- Decision-making under uncertainty
| Skill Category | Declining Importance | Rising Importance |
| Manual reporting | ✔ | |
| Business context | ✔ | |
| Critical thinking | ✔ | |
| Tool memorization | ✔ | |
| Strategic insight | ✔ |
Technical skills remain necessary but no longer sufficient.
How Businesses Should Prepare for 2026
A practical readiness checklist:
| Area | Key Actions |
| Strategy | Align analytics with business outcomes |
| Architecture | Move toward unified data platforms |
| Governance | Establish privacy and quality frameworks |
| Talent | Develop hybrid technical-business skills |
| Culture | Encourage data-driven decision making |
Organizations that treat analytics as an IT project rather than a strategic capability risk underperformance.
Future Outlook Beyond 2026
Looking ahead, analytics is moving toward:
- Fully autonomous operational systems
- Human-AI collaboration models
- Predictive governance and compliance
- Continuous experimentation at scale
Eventually, the competitive landscape may divide into:
Organizations that act on data automatically
vs
Organizations that still analyze data manually
That divide will determine market leaders.
Final Thought
The biggest misconception about data and analytics trends is that they are about tools. They are not. They are about decision speed, decision quality, and organizational intelligence.
In 2026, success will belong to organizations that can transform raw data into trustworthy action faster than their competitors — safely, ethically, and at scale.