
The best data analytics software depends less on features and more on organizational readiness, data scale, and decision goals. Power BI, Tableau, Looker, Qlik Sense, and SAS lead the market because each dominates a different stage of analytics maturity.
Most organisations nowadays are full of data yet they are starving of intelligence. Firms spend much money on dashboards and reporting applications when they find that months later teams are still using spreadsheets or making decisions through their gut. It is not that there is no data, it is the selection of the software that does not correspond to actual capabilities, workflows, or objectives.
An inappropriate analytics platform will result in a lack of adoption, incorrect reporting, and concealed costs, and stagnant digital transformation. In the meantime, their competitors with the right tools work quicker, foresee trends sooner and maximize nonstop.
It is not the most powerful tool, but that that fits your level of analytics maturity. The market is dominated by the five platforms listed below as each of them addresses a different type of problem – a beginner reporting to enterprise-grade predictive intelligence.
Table of Contents
How We Evaluated the Best Data Analytics Software
Majority of the rankings are centered on feature lists. The actual implementation, adoption, and scaling of the tool by the teams will determine whether the tool is a success in real-world.
Significant ones were usability, visualization power, breadth of integration, large-scale performance, governance functionality, AI, and overall cost of ownership.
The 5 Best Data Analytics Software (Ranked by Use Case)
Microsoft Power BI — Best Overall Value & Entry Point
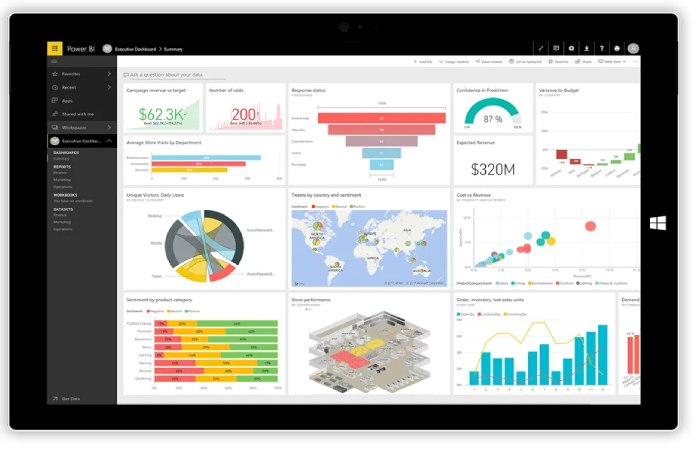
Microsoft Power BI has become the default starting point for analytics in thousands of organizations because it delivers enterprise-level capability at an unusually low price.
Its tight integration with Excel, Azure, and Teams dramatically reduces implementation friction. Beginners can build useful dashboards quickly, while advanced users can create complex models using DAX and dataflows.
However, at extreme data scale or with highly complex modeling requirements, performance tuning can become challenging.
Best for: Organizations launching or expanding analytics with strong cost sensitivity.
Tableau — Best for Advanced Visualization & Storytelling
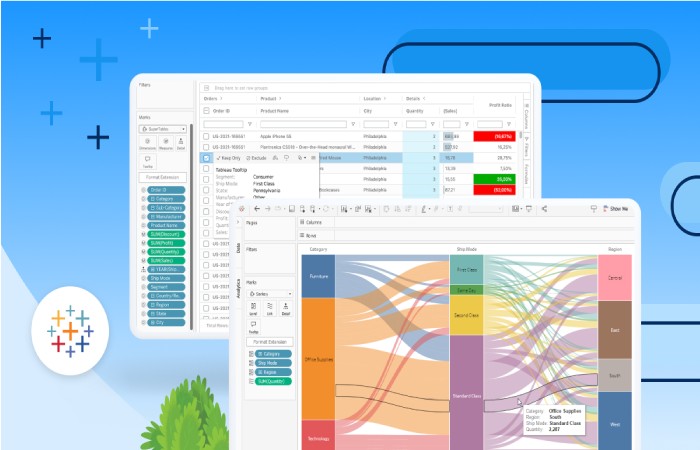
Owned by Salesforce, Tableau remains the benchmark for visual analytics. Its dashboards are highly interactive and presentation-ready, making it a favorite among analysts and consulting firms.
Tableau excels when insights must persuade stakeholders, not just inform them. The trade-off is higher licensing costs and a steeper learning curve compared with Power BI.
Best for: Teams where visual clarity and storytelling drive decision impact.
Google Looker — Best for Cloud-Native Analytics
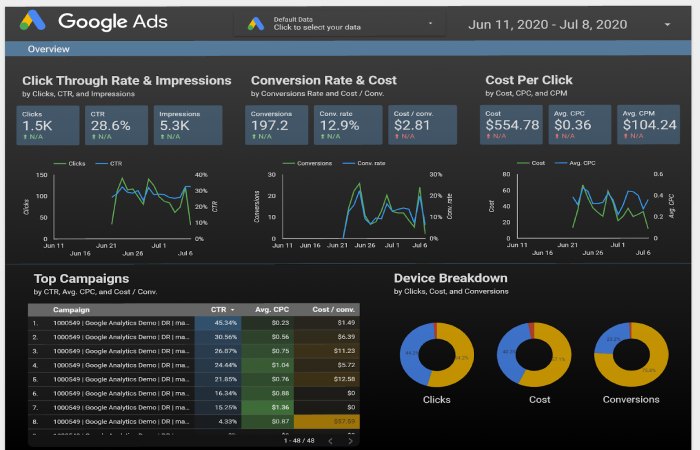
Google Looker is designed for modern cloud data architectures. Instead of importing data, itqueries it directly in warehouses like BigQuery, enabling near real-time analytics at scale.
Its semantic modeling layer ensures that business metrics remain consistent across departments — a major advantage as organizations grow.
Best for: Technology-driven companies operating primarily in the cloud.
Qlik Sense — Best for Exploratory Data Discovery
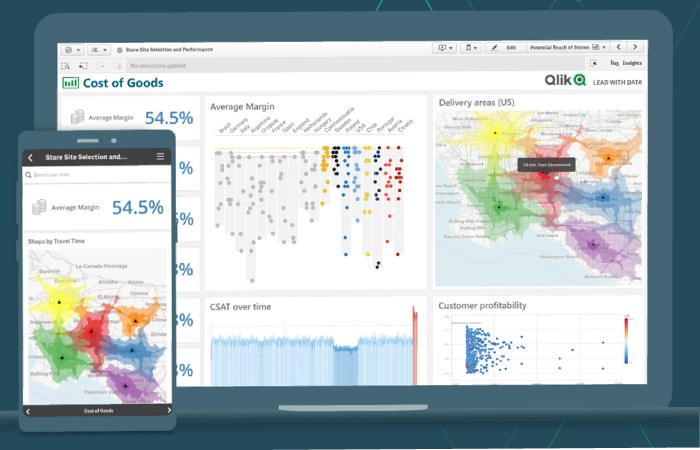
Qlik Sense stands out with its associative engine, which allows users to explore data freely rather than following predefined queries.
This approach helps uncover hidden relationships and root causes that traditional dashboards might miss.
Best for: Organizations focused on investigative analysis and operational optimization.
SAS Analytics — Best for Advanced Predictive & Statistical Work
For decades, SAS Institute has been synonymous with rigorous statistical analysis. Industries such as banking, healthcare, and government rely on it for high-stakes forecasting and compliance.
SAS is exceptionally powerful but requires specialized expertise and significant investment, making it unnecessary for routine business reporting.
Best for: Enterprises needing deep predictive analytics and regulatory reliability.
Side-by-Side Comparison
| Software | Ease | Visualization | Scale | AI | Cost | Ideal Users |
| Power BI | Very High | High | High | High | Low | Most organizations |
| Tableau | Medium | Very High | High | High | High | Analysts & consultants |
| Looker | Medium | High | Very High | High | Medium-High | Cloud-native firms |
| Qlik Sense | Medium | High | High | High | Medium | Exploratory teams |
| SAS | Low | Medium | Very High | Very High | Very High | Enterprise & research |
Choosing Based on Your Data Maturity Stage
Stage 1 — First Dashboards: Simplicity and cost matter most → Power BI
Stage 2 — Cross-Team Analytics: Governance and collaboration → Tableau, Qlik
Stage 3 — Predictive Decisions: Advanced modeling → SAS
Common Mistakes When Selecting Analytics Software
Organizations tend to fail because they select tools using feature list, they underestimate training requirements, they ignore data quality preparedness or even long term costs like infrastructure and talent.
Final Verdict
There is no universal winner. The optimal choice depends on your organization’s readiness, scale, and decision ambitions.
- Best overall value: Power BI
- Best visualization: Tableau
- Best cloud analytics: Looker
- Best discovery: Qlik Sense
- Best advanced analytics: SAS
Choose the tool that your team will actually use — because unused analytics delivers zero insight, no matter how powerful the software.